 Here we want to find the benefits or downfalls of two approaches for making a marketing budget: based on your revenue or based on your known conversion rates. Right off the bat I’ll disclose which I prefer so that you’ll be aware of any bias: conversions.
Many times we’ve established marketing budgets based on the previous year or quarter’s revenue. Depending on the time of year, product or service and distinct goals, we’ll give the marketing budget a wide window of between 10 and 15% of revenue. Immediately, this method lets you know exactly what you have to work with and as your business grows, so does your budget, which, provided you have a high ad efficiency, it will give you continued growth and predictable marketing costs.
OK… but what if you’re in a situation where last year’s sales were not as good as you want and this year you want to be aggressive? How can you be aggressive with your online marketing efforts in a more intelligent way than just throwing more money at it?
Welcome to why conversions can be wonderfully cool and helpful. Lots of good conversion data can help you take well-calculated risks when targeted a specific sales number or amount.
Basing a marketing budget on conversions doesn’t look at the money you’ve made, but rather the money you want to make in that period. We like to look forward and what we will achieve rather than behind at what we’ve already done.
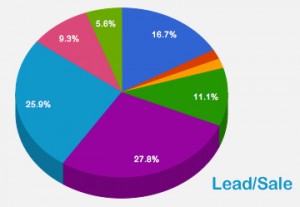
This requires that you have solid historical marketing and sales data, and are ready and willing to do more math that a single percentage calculation. For the sake of example, lets assume you have accurate conversion data for 1000 sales beginning with website visits, leads, and sales. Ideally, your sales conversions broken down into product profit categories that are weighted appropriately – this allows you to make judgements both quantitatively (number of products sold) and qualitatively (amount of profit for products sold). In short, this gives you some room to spend more for marketing products that give you a higher profit margin.
The basic quantity and quality conversions:
- Visit -> Lead -> Sale :: (quantity)
- Visit -> Lead (cost for lead) -> Sale (cost for sale) -> Profit :: (quality)
- Cost Per Lead (General and by Category)
- Cost Per Sale (General and by Category)
- Cost Per Visit (Generalized with all traffic sources)
- Profit by Category
Every day. Look at it every day. Know it. Know the trends by day or the week and month of the year. You’ll start to get intuitive about the trends the more you watch and compare reports.
You’ve most likely noted in your head already that the latter needs to be broken into products or product category so that you can see which have the lowest cost per lead, cost per sale, and the highest profit margin. Those break downs give you both where to put money insofar as what is working, and for those products that are not getting a good margin, you have identified areas that need to be improved in the sales process or product itself.
If the above case you see how much money needs to go in in order to get another amount (profit) at the end. Of course, this isn’t perfect… people change, trends change, but it’s a guide based on numbers with which you can be confident to exercise.
Let’s say you combine all your products and marketing, and get an advertising/marketing margin or ROI of 90% (for those of you who read between the lines… yes, this approach is pretty much the inverse of looking back and previous revenue). From that point, determine what your profit needs to be, and then you know how much (generally) to spend.
This is more helpful, however, when you break it down into product categories as mentioned above, so that you can gauge by each campaign and product which is getting the best margin individually, and which are not. If there’s enough of a market to focus on the high-margin products: do it! And, of course, focus on optimizing the products and campaigns that are not getting you a desired return.
For quantity (for example if you have one product or service) you work backwards in the same way. Let’s say you have a 5% visit to lead conversion, and a 30% lead to sale conversion. If you need to make 50 sales you in turn need 167 leads, and (rounded) 3400 visits. If you’re conversion data is very good, then you know how many come from organic search, search engine marketing, social media, traditional media, and pay per lead sources – combine those and you know how much you need to spend in each channel to get those 50 sales.
It’s not a guarantee to get you the numbers, but it’s a good way to make projections and be proactive about making a marketing budget based on goals rather than reactive based on the past.
Moral: make sure you have good conversion data! 😉


